logo_image() places an image on the drawing canvas. This function is not
intended to be used on its own, but instead should be added to a ggplot2 plot
to add a logo to the plot. logo_layout() arranges the plot and image so
that the image is in the bottom right. The default layout can be overridden
if, for example, you are adding a logo to a patchwork of multiple plots.
Sets up the layout for a plot combined with a logo image.
logo_image(
  image = system.file("SageBionetworks-Logo.png", package = "sagethemes")
)

logo_layout(ncol = 1, heights = c(1, 0.1), design = "AAAAAA\n####BB", ...)
Arguments
- image
Path to image file to be added
- ncol
The dimensions of the grid to create - if both are
NULLit will use the same logic as facet_wrap() to set the dimensions- heights
The relative widths and heights of each column and row in the grid. Will get repeated to match the dimensions of the grid.
- design
Specification of the location of areas in the layout. Can either be specified as a text string or by concatenating calls to
area()together. See the examples for further information on use.- ...
Additional parameters passed to
patchwork::plot_layout()
Examples
library("ggplot2")
library("patchwork")
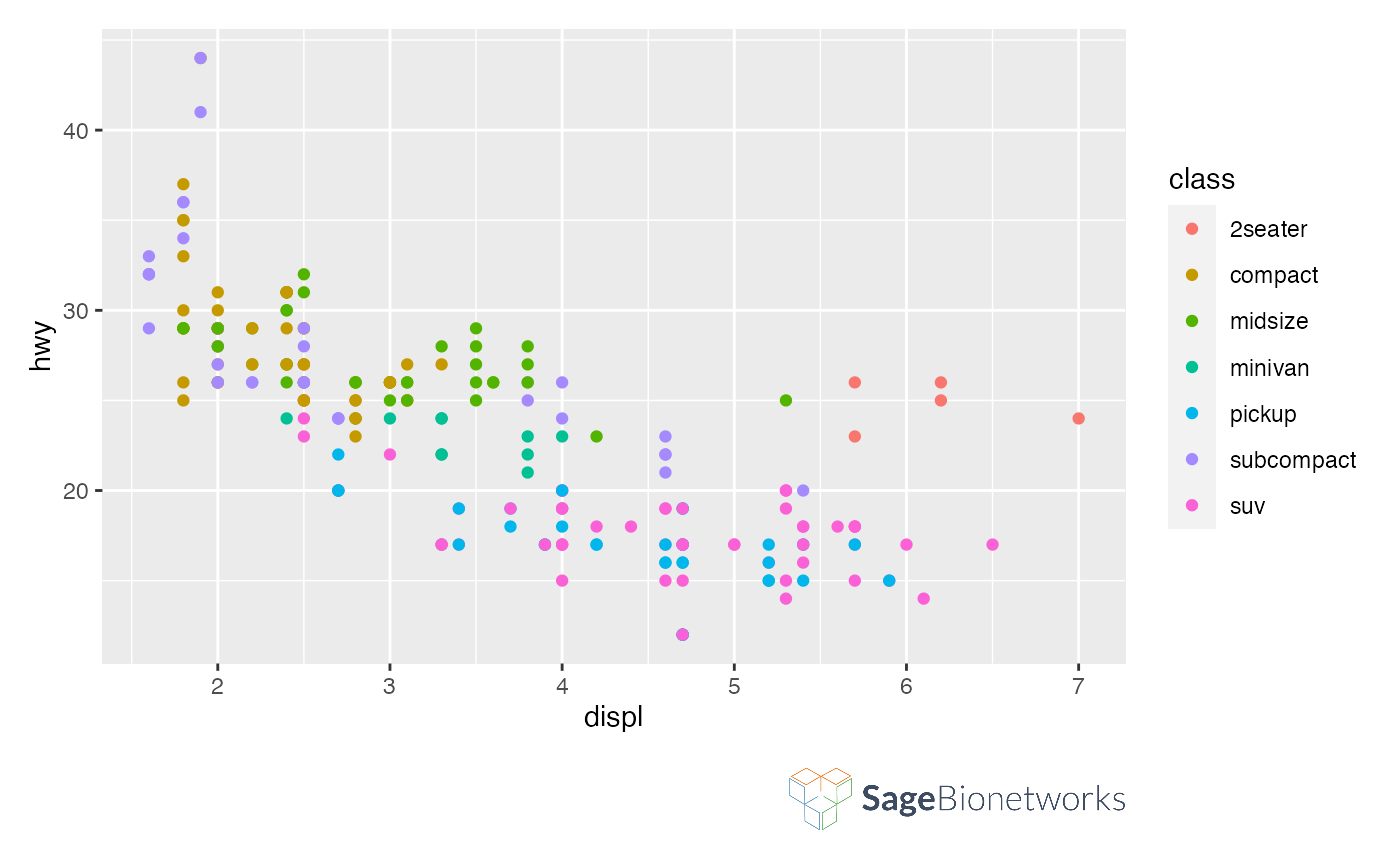
ggplot(mpg, aes(displ, hwy, colour = class)) +
geom_point() +
logo_image() +
logo_layout()
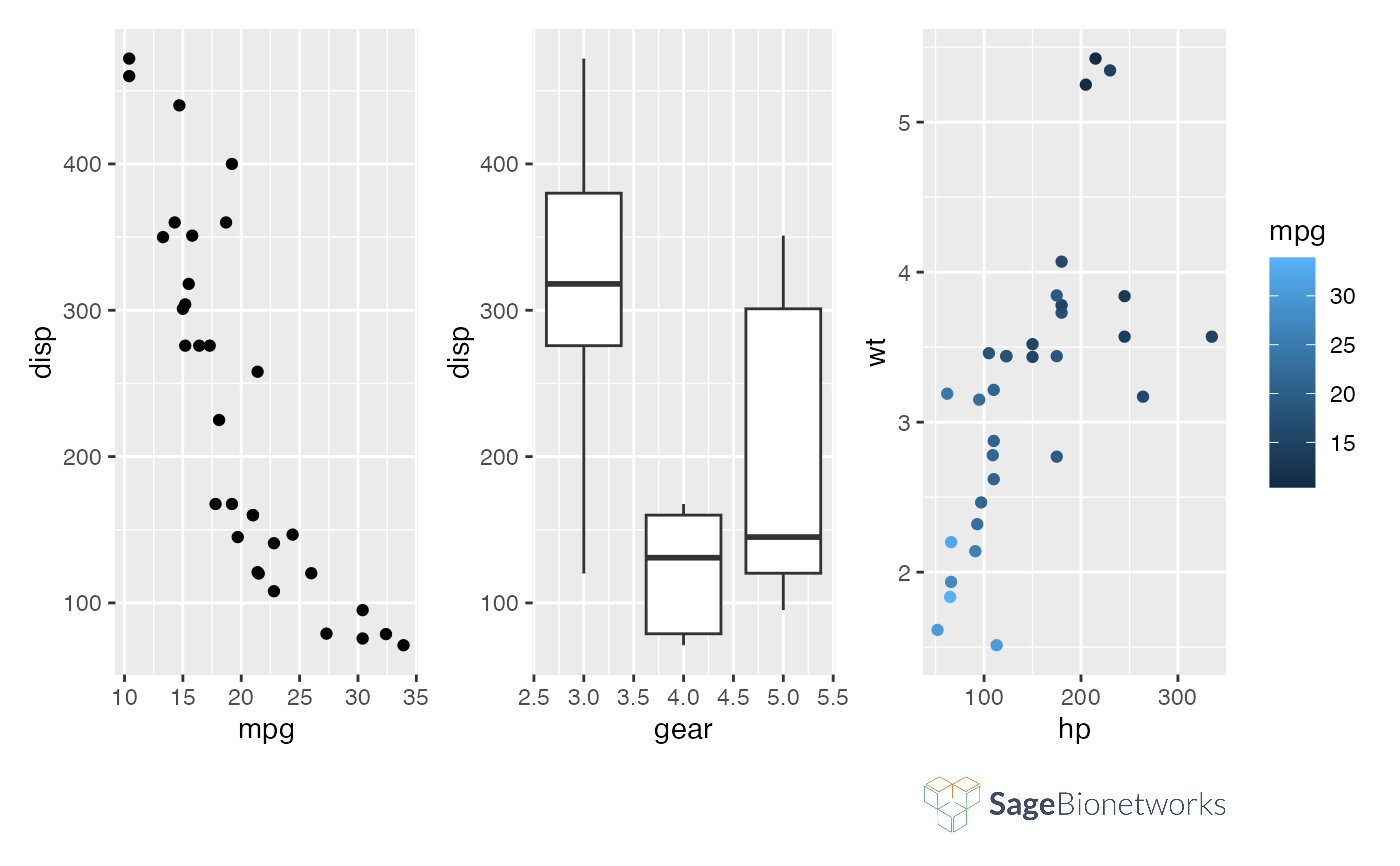
 # When adding logos to more complex figures, you may want to customize
# logo_layout() (or use patchwork::plot_layout() directly)
p1 <- ggplot(mtcars) +
geom_point(aes(mpg, disp))
p2 <- ggplot(mtcars) +
geom_boxplot(aes(gear, disp, group = gear))
p3 <- ggplot(mtcars) +
geom_point(aes(hp, wt, colour = mpg))
p1 + p2 + p3 +
logo_image() +
logo_layout(ncol = 3, nrow = 2, design = "AABBCC\n####DD")
# When adding logos to more complex figures, you may want to customize
# logo_layout() (or use patchwork::plot_layout() directly)
p1 <- ggplot(mtcars) +
geom_point(aes(mpg, disp))
p2 <- ggplot(mtcars) +
geom_boxplot(aes(gear, disp, group = gear))
p3 <- ggplot(mtcars) +
geom_point(aes(hp, wt, colour = mpg))
p1 + p2 + p3 +
logo_image() +
logo_layout(ncol = 3, nrow = 2, design = "AABBCC\n####DD")
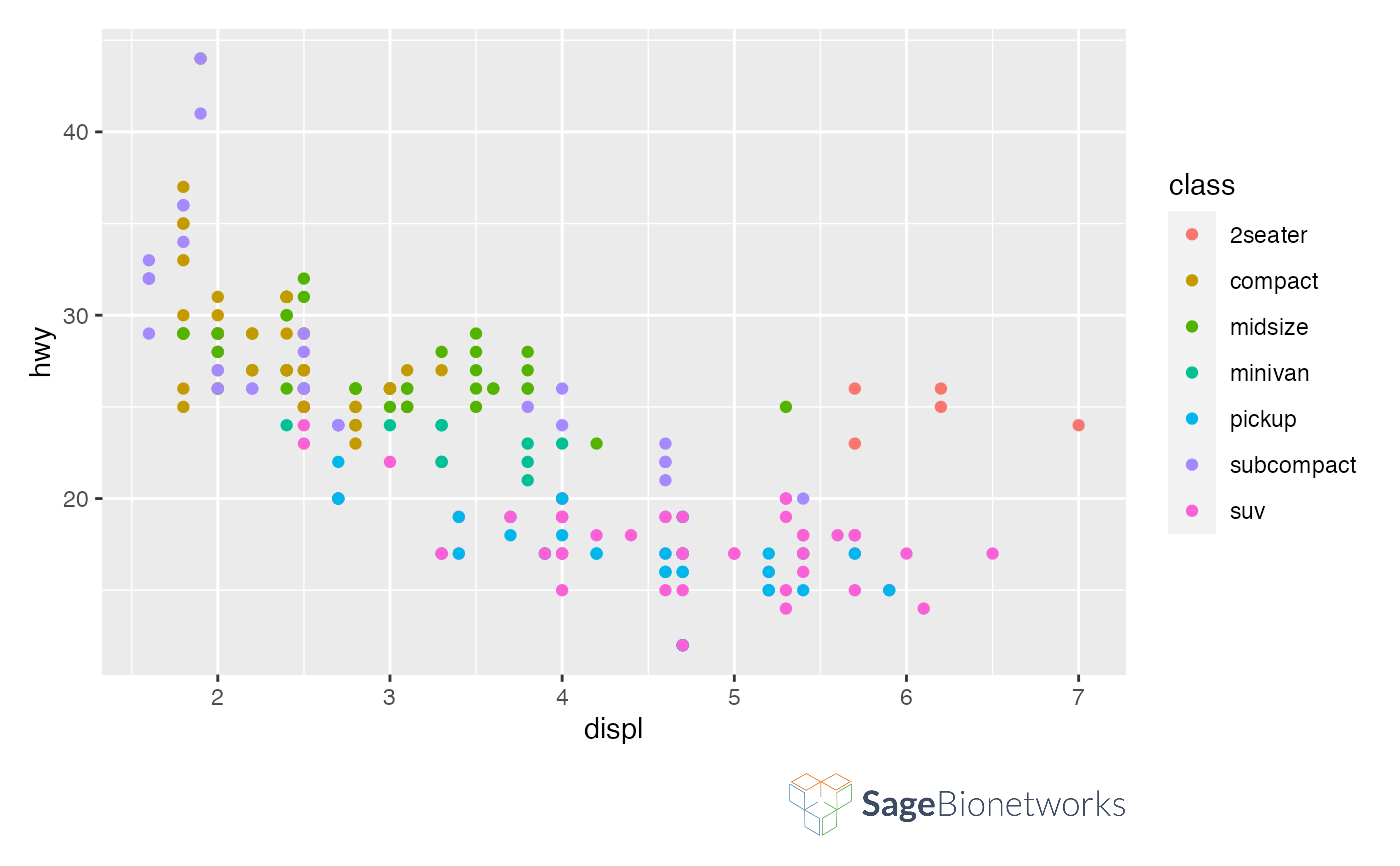
 # By default, the logo size will scale as you resize the plotting window. You
# can instead choose to keep its size constant and let only the plot size
# scale:
ggplot(mpg, aes(displ, hwy, colour = class)) +
geom_point() +
logo_image() +
logo_layout(heights = unit(c(1, 1), c('null', 'cm')))
# By default, the logo size will scale as you resize the plotting window. You
# can instead choose to keep its size constant and let only the plot size
# scale:
ggplot(mpg, aes(displ, hwy, colour = class)) +
geom_point() +
logo_image() +
logo_layout(heights = unit(c(1, 1), c('null', 'cm')))