These create a gradient of colors based on the high and low value of a given hue from within the list of Sage branded colors.
scale_colour_sage_c(
  ...,
  option = "royal",
  low = NULL,
  high = NULL,
  na.value = "grey50",
  guide = "colourbar",
  aesthetics = "colour"
)

scale_fill_sage_c(
  ...,
  option,
  low = NULL,
  high = NULL,
  na.value = "grey50",
  guide = "colourbar",
  aesthetics = "fill"
)
Arguments
- ...
Options passed to
ggplot2::continuous_scale()- option
One of the Sage colors. See
names(sage_colors)for a list.- low
Colours for low and high ends of the gradient.
- high
Colours for low and high ends of the gradient.
- na.value
Colour to use for missing values
- guide
Type of legend. Use
"colourbar"for continuous colour bar, or"legend"for discrete colour legend.- aesthetics
Character string or vector of character strings listing the name(s) of the aesthetic(s) that this scale works with. This can be useful, for example, to apply colour settings to the
colourandfillaesthetics at the same time, viaaesthetics = c("colour", "fill").
Examples
library("ggplot2")
df_na <- data.frame(
value = seq(1, 20),
x = runif(20),
y = runif(20),
z1 = c(rep(NA, 10), rnorm(10))
)
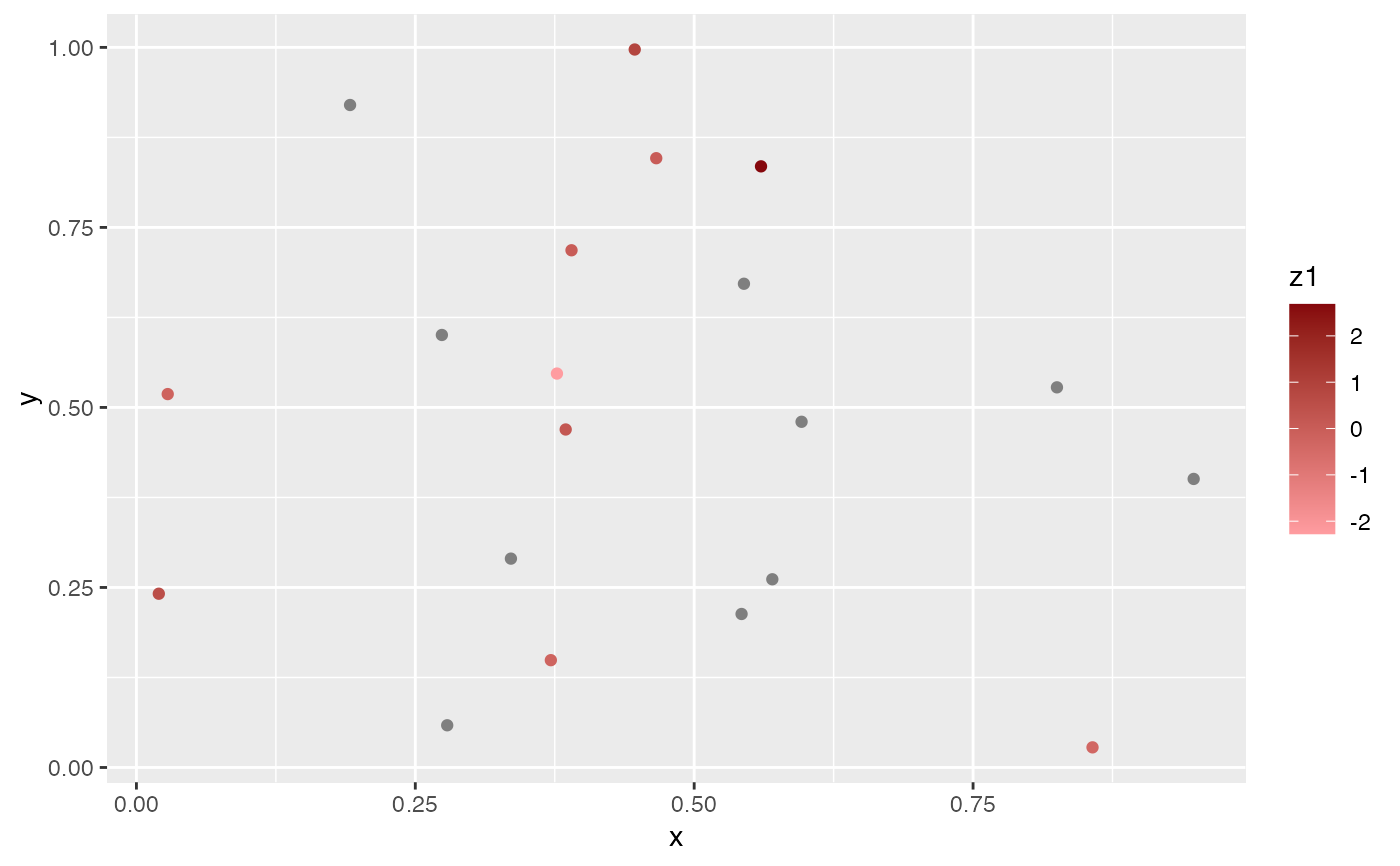
ggplot(df_na, aes(x, y)) +
geom_point(aes(colour = z1)) +
scale_colour_sage_c(option = "apple")
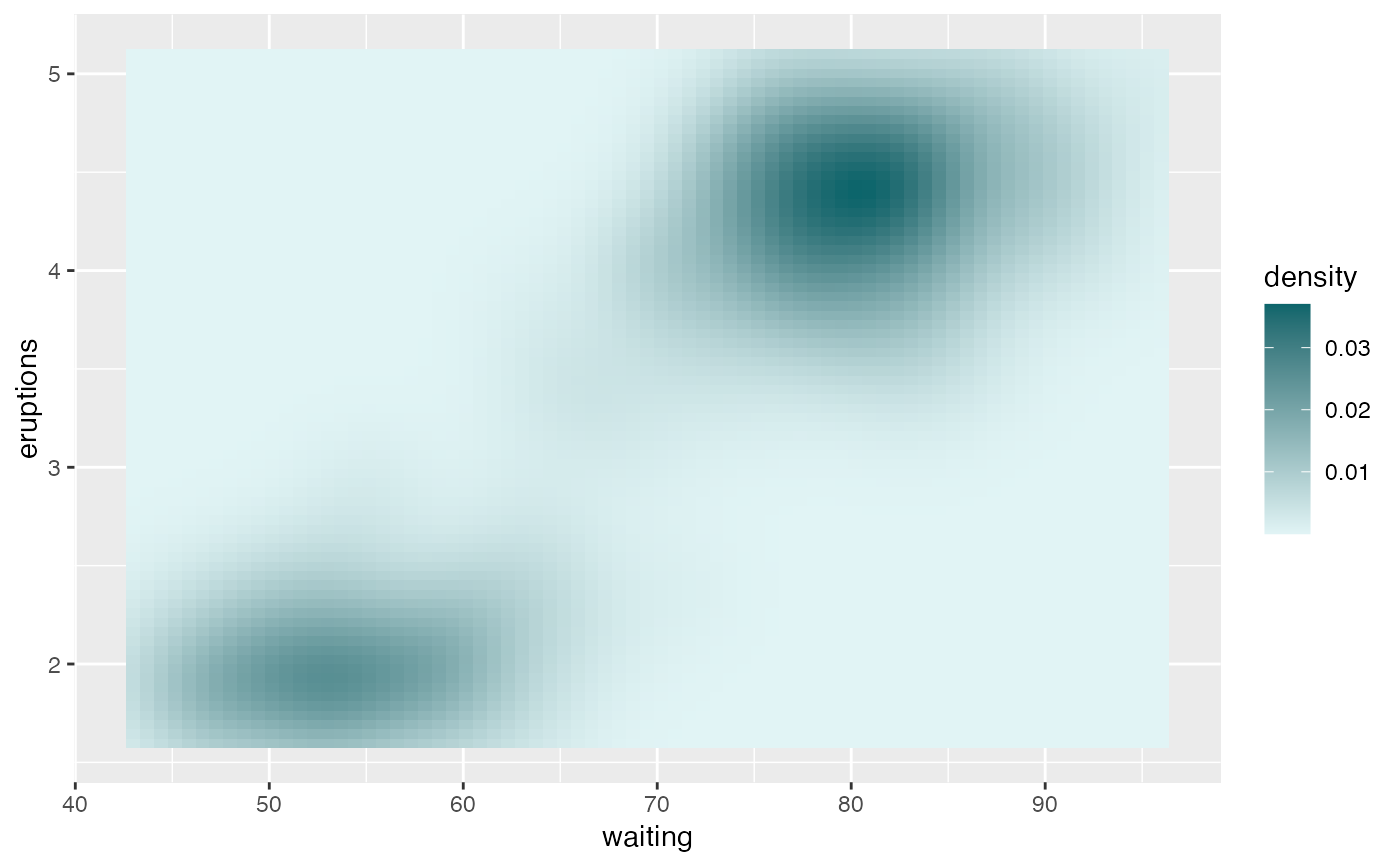
 ggplot(faithfuld, aes(waiting, eruptions, fill = density)) +
geom_tile() +
scale_fill_sage_c(option = "powder")
ggplot(faithfuld, aes(waiting, eruptions, fill = density)) +
geom_tile() +
scale_fill_sage_c(option = "powder")